Can We Identify Careless Responses in PISA Data?
- Yulia Kuzmina
- Apr 8
- 5 min read


Recently, I wrote a post for our Russian-language Telegram channel Cognitive Psychometrics, based on a paper about careless responses (CR) (Stosic, M. D., Murphy, B. A., Duong, F., Fultz, A. A., Harvey, S. E., & Bernieri, F. (2024). Careless responding: Why many findings are spurious or spuriously inflated. Advances in Methods and Practices in Psychological Science, 7(1), 25152459241231581)
Briefly, careless response (CR) refers to item-level answers on a test or questionnaire that are given without proper attention. CR can take many forms: random responding, overly consistent patterns (e.g., selecting the same option repeatedly), or erratic answering due to fatigue or disinterest. Essentially, it captures any pattern that suggests a participant wasn't paying attention to item content.
Traditionally, researchers have assumed that including respondents with CRs leads to underestimation of effects (e.g., attenuated correlations between latent variables). However, the paper I discussed argued that the opposite is more common: CRs more often inflate correlations and increase the risk of false positives.
The authors recommend that detecting careless responses should become part of standard data processing practices. For this purpose, they highlight the R package careless, which implements several detection techniques. I decided to apply this package to PISA 2022 data (Serbia sample) to see how effective it is in identifying CR in real large-scale educational data.
What I Did
I selected two self-report scales from the student questionnaire:
Bullying scale (9 items)
Sense of belonging to school scale (6 items)
My goal was to show how difficult it can be to identify careless responses when only one short scale is available—especially in structured international surveys like PISA.
Recap: What’s in These Scales?
Bullying Scale (9 items): Participants were asked how often they experienced various forms of bullying in the past 12 months. Example items:
“Other students left me out of things on purpose”
“I got hit or pushed around by other students”
“I gave money to someone at school because they threatened me”
Responses:1 = Never or almost never; 2 = A few times a year; 3 = A few times a month; 4 = Once a week or more.
Sense of Belonging to School (6 items): This scale includes both positively and negatively worded items. For example:
“I feel like an outsider at school” (negative)
“I feel like I belong at school” (positive)
Responses:1 = Strongly agree; 2 = Agree; 3 = Disagree; 4 = Strongly disagree
Metrics from the careless Package
The careless package offers several useful metrics. Assuming we are dealing with Likert-type scales, here’s what I used:
1. Longstring
The longstring index is the length of the longest run of identical responses. For example: 4, 4, 4, 4, 4, 3, 4, 4, 4 → Longstring = 5
While longstring might seem useful, it’s problematic for certain scales. For instance, many students may genuinely report "Never" (option 1) across all bullying items. In the Serbian sample, 59% of students selected “1” on all 9 items. This suggests that longstring may not be a valid CR indicator for unidirectional behavioral scales like bullying.
However, longstring might still be useful when applied to combined scales or scales with reversed items, where uniform responses are less likely.
2. Mahalanobis Distance
Mahalanobis Distance (MD) is a multivariate outlier detection metric. It calculates the distance of a participant’s response pattern from the mean response pattern, accounting for item intercorrelations.
A high MD suggests the participant gave unusual responses that deviate from the overall pattern—possibly due to inattentiveness or random responding.
I used the 90th percentile of the MD distribution as a cutoff for detecting outliers.
3. Intra-Individual Response Variability (IRV)
IRV is the standard deviation of an individual’s responses across a group of items. It can detect:
Low variability → possibly straightlining
High variability → possibly random responding
Some authors recommend flagging low IRV values (indicating straightlining), while others flag high IRV values (indicating noise). The choice may depend on the scale. For the bullying scale, I flagged participants with high IRV as potentially inattentive.
Results
Bullying Scale
Longstring: Not very useful. A value of 9 (maximum) was observed in 3843 respondents (64% of valid cases).
Mahalanobis Distance: Ranged from 0.28 to 171.85. I used 29.95 (90th percentile) as the cutoff.
IRV: Mean = 0.24, 90th percentile = 0.88. I used 0.88 as a cutoff for high variability.
Flagged as inattentive if: MD > 29.95 and IRV > 0.88→ 471 participants were flagged.
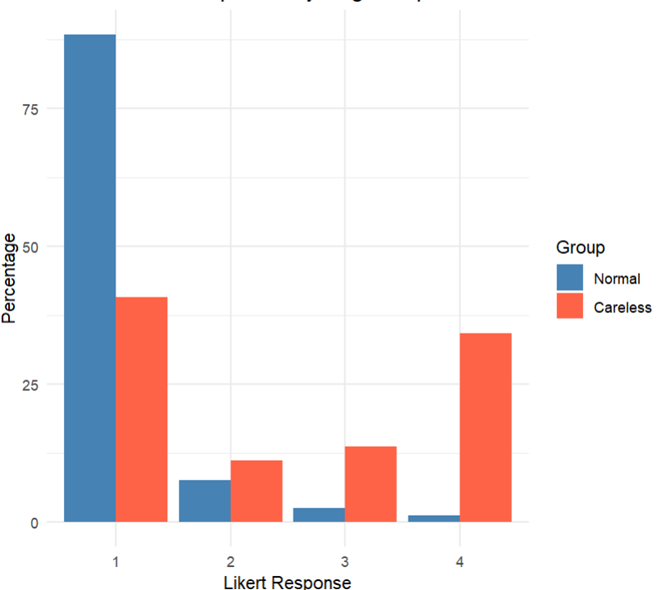
I investigated the mean responses on items for Attentive and Inattentive participants. Interestingly, inattentive respondents tended to select higher values, inflating perceived bullying rates. All differences were statistically significant (Mann-Whitney test). We can see that inattentive respondents tend to select higher values on Likert scale as these participants tend to select options “3” and “4” more often. I create the graph of percentages of selection four options for attentive and inattentive participant in the first item, just for example (Other students left me out of things on purpose):
Belonging to School Scale
Many respondents had missing values, so I included those who answered at least 4 items.
Longstring: Max = 5 (only 35 participants). Cutoff = 4.
MD: Range = 0.16 to 49.36. 90th percentile = 14.84
Flagged as inattentive if: Longstring ≥ 4 and MD > 14.84→ 14 participants flagged.
Correlation Analysis
Total sample (with CR): Correlation between indices = -0.25
Attentive respondents only: Correlation = -0.20
This drop in correlation supports the idea that CR inflates relationships between constructs—especially when response patterns are noisy or extreme.
Some Thoughts and Reflections
1. Careless responding is not just a data-cleaning step—it should be part of study design from the beginning.
One thing that becomes painfully clear when working with real-world data like PISA is that careless responses aren't always easy to spot after the fact. A lot of detection methods work best when the questionnaire includes certain types of items—like reverse-scored questions, instructed-response checks (e.g., “Please select ‘Strongly agree’ for this item”), or even fake items designed to catch inattentive respondents. But PISA doesn’t include any of that. Take the bullying scale, for instance—it’s made up entirely of questions phrased in the same direction, so someone selecting “Never” for all nine might just genuinely be someone who wasn’t bullied. Or… they could be straightlining their way through the survey. We can’t know for sure. That’s why I think CR detection strategies should be built into the questionnaire design from the start—not something you try to patch on at the end.
2. Researchers have a lot of flexibility—and that’s both a strength and a danger.
When it comes to identifying careless responses, there's no single "correct" method. We can choose different metrics: Mahalanobis distance, longstring values, intra-individual variability, and more. Even within those methods, we have to decide on thresholds: Should we flag the top 10% as outliers? Top 5%? And should a response be flagged as careless only if all the criteria are met—or just one? Depending on these decisions, we might end up with just a handful of flagged cases—or hundreds. In other words, these aren’t just technical choices; they can change the outcome of the analysis. This flexibility can be useful, but it also opens the door to unintentional (or intentional) bias. The researcher’s decisions can shift the narrative.
3. Yes, even in PISA.
It might be tempting to assume that in high-quality, large-scale international studies like PISA, careless responding isn’t a big issue. After all, the data collection is standardized, quality controls are in place, and the stakes are high. But my analysis suggests otherwise: even here, we can spot a non-trivial number of students whose responses seem suspicious. Whether it's long strings of identical answers or unusually inconsistent response patterns, the signs are there. And if we ignore them, we risk inflating correlations, misinterpreting results, and drawing the wrong conclusions about students' attitudes and experiences.
If you're working with self-report data from large assessments—or designing your own scales—don't ignore careless response. It's not just noise; it might be changing your conclusions.


Comments